Explained
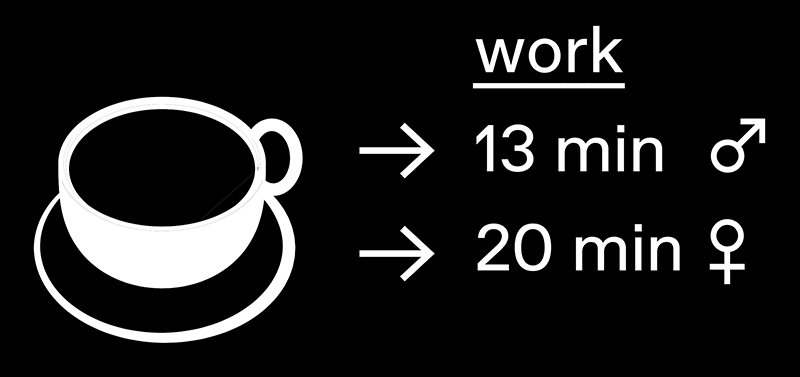
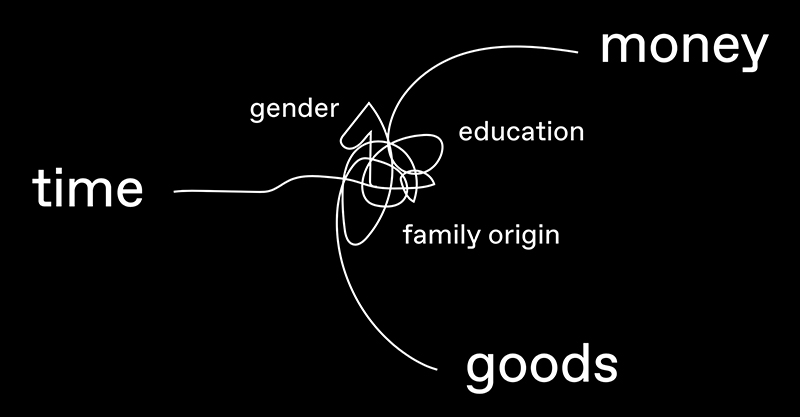
Exploring the relationship between time, money and goods.
↑ Menu list
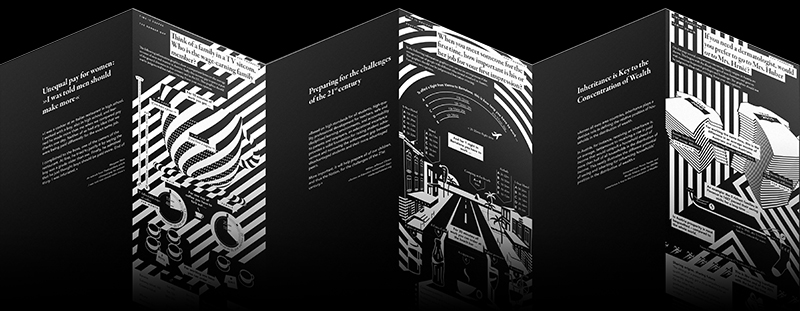
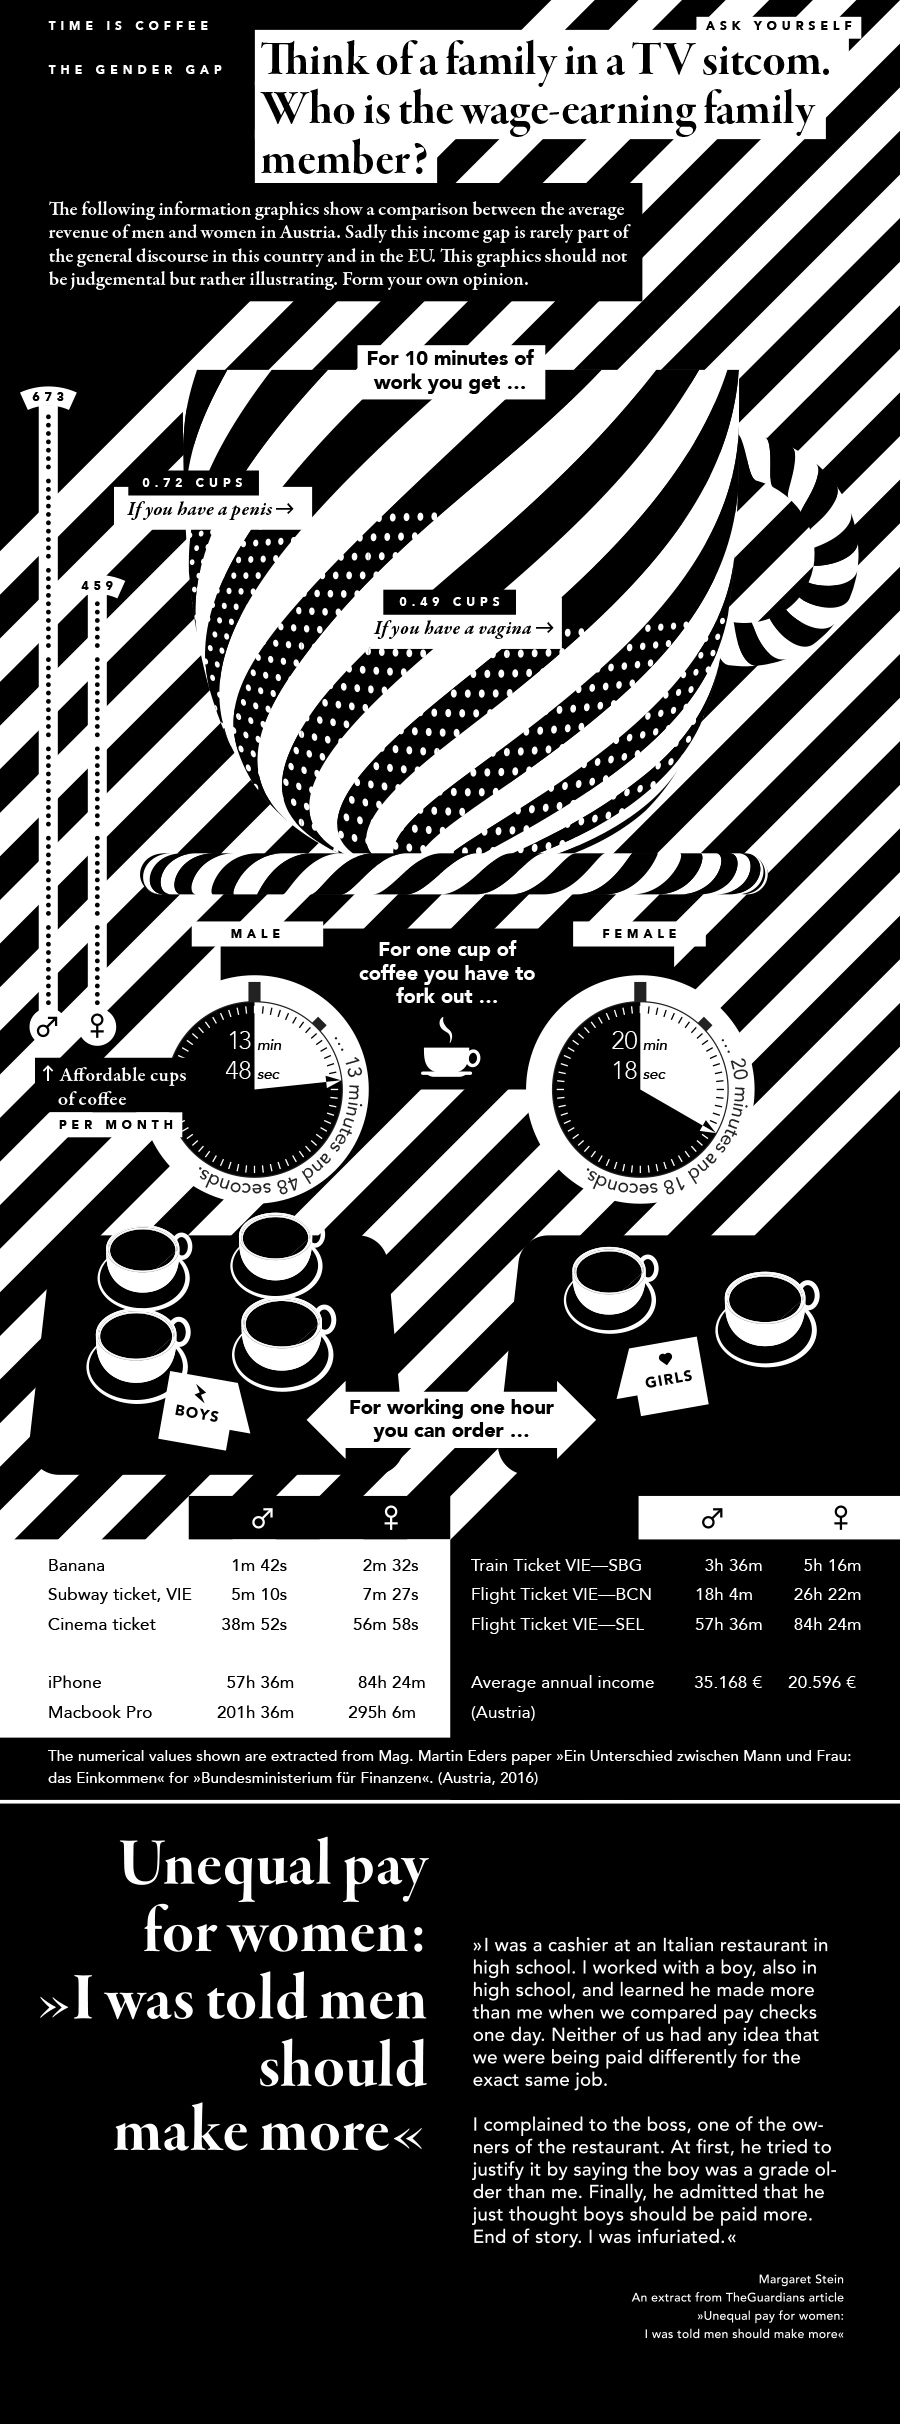
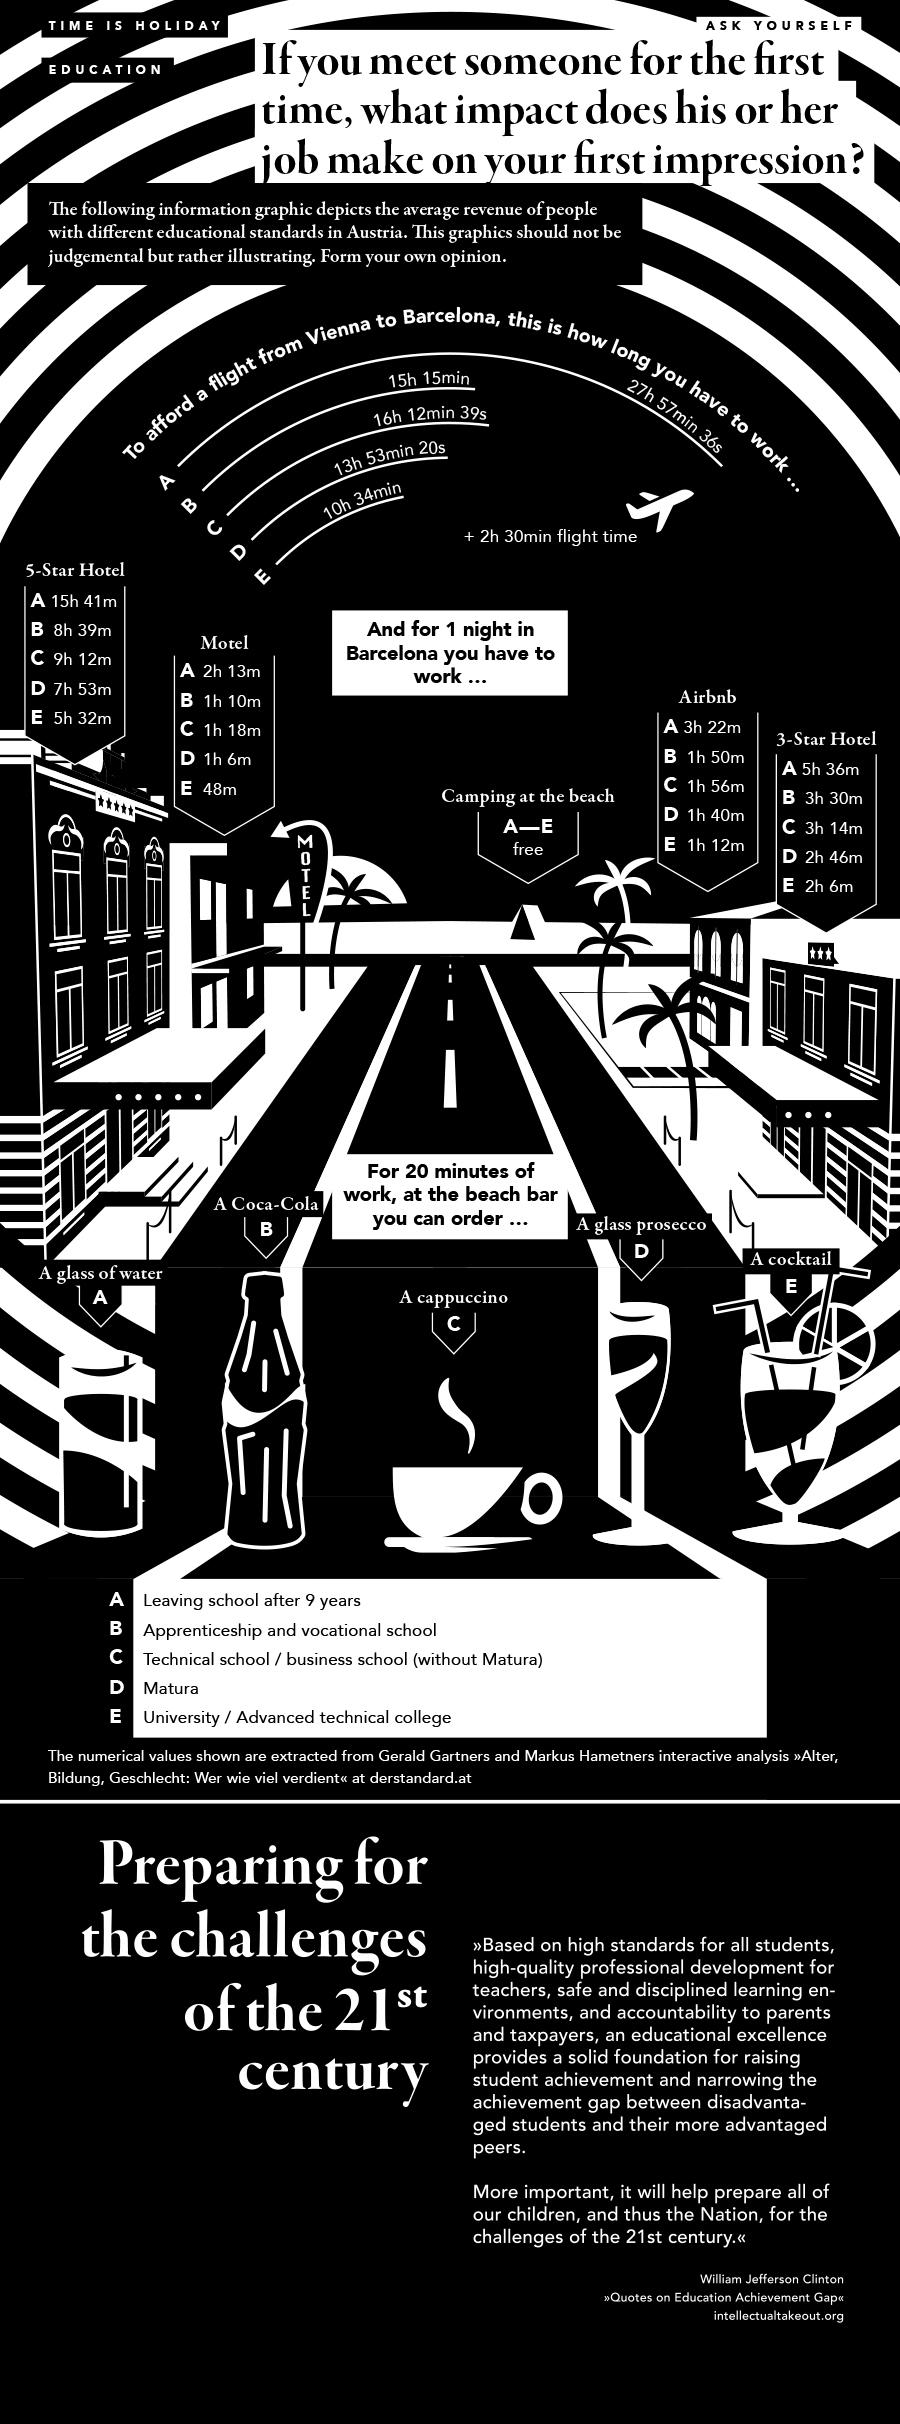
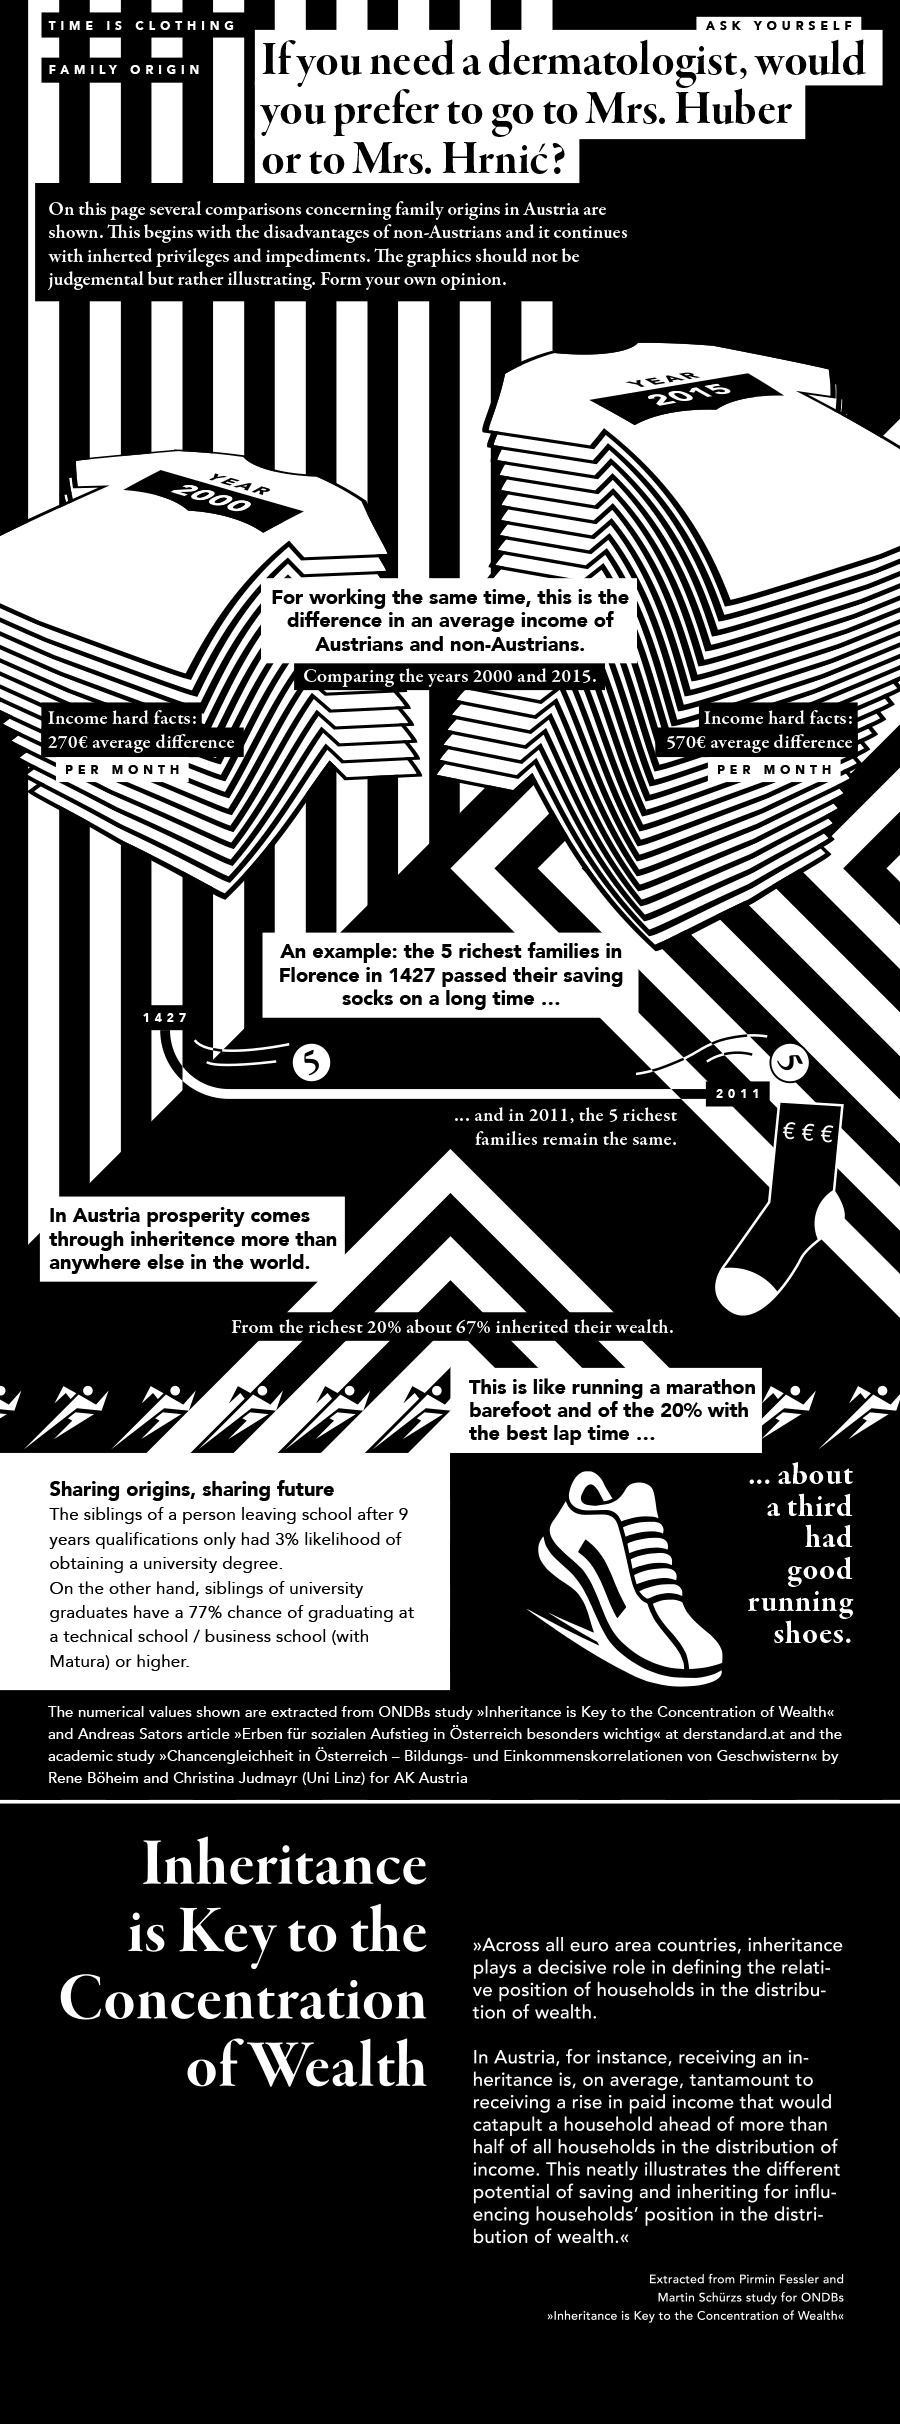
The data visualizations were kept in black and white, as this was one of the tasks I set myself.
They consist of a headline and introduction text, different information graphics, a table to compare exact values, the source, and a quote/text to summarize the topic.
↑ Menu list
Product 2 is a prototype for an app or a website, addressing more digital-attracted people.
↑ Menu list